


Getting started with Google Cloud Monitoring APIs
Exploring custom monitoring metrics!


If you have your application deployed, you particularly want to focus on pushing features as soon as possible and not spend time checking if your services are down, right? This is where monitoring comes into picture.
Google cloud operations suit, earlier known as Stackdriver provides a built-in monitoring dashboard for you to check various metrics from your projects on either GCP or in hybrid environments.
In this blog, I am going to explain how to use built-in functions create_time_series from google-cloud-monitoring, a python library to work with cloud monitoring APIs. You don't necessarily have to know how APIs work, because hey, we have this library with built in functions but some python knowledge is a good-to-have. A possible use case could be, to push custom metrics from your application to the monitoring dashboard to visualise them.
Monitoring your environment [Photo by Justus Menke on Unsplash]
What is a metric anyway?
Metrics on GCP have the three elements listed below:
- A set of data points.
- Metric-type information, which tells you what the data points represent.
- Monitored-resource information, which tells you where the data points originated. This can be anything from your VMs to K8s clusters or any task that has been defined by you.
First things first! If you are a a python developer you know the drill already :D
pip install google-cloud-monitoring
##Creating custom metrics and writing data to time series Your custom metric should have a string identifier unique among all the metric names in your google cloud project, and prefixed with custom.googleapis.com. So if your metric is called my-metric, the identifier will look like custom.googleapis.com/my-metric.
Note: Because these metric identifiers have to be unique, you can understand that if you try to write data to an existing metric i.e. one that already has a defined source, you will receive an error. I was stuck at a 403 for some time! A tip that always works for me is to refer to the library's source code to see what is happening how! Or simply keep printing out stuff at every step 😛
Now coming to monitored resource, let's say this custom metric of ours is being generated by a virtual machine, so your resource type is gce_instance. You can find a list of resource types here. You can add a fields 'labels' to specify any labels you want for the resource. For example, instance_id or zone. Remember that this is additional information about our data source.
.create_metric_descriptor()
.create_time_series()
If you write metric data when a metric descriptor for that custom metric doesn't yet exist, then a metric descriptor is created automatically.
Now that we have a custom metric, we can write our data points to display them on the monitoring dashboard.
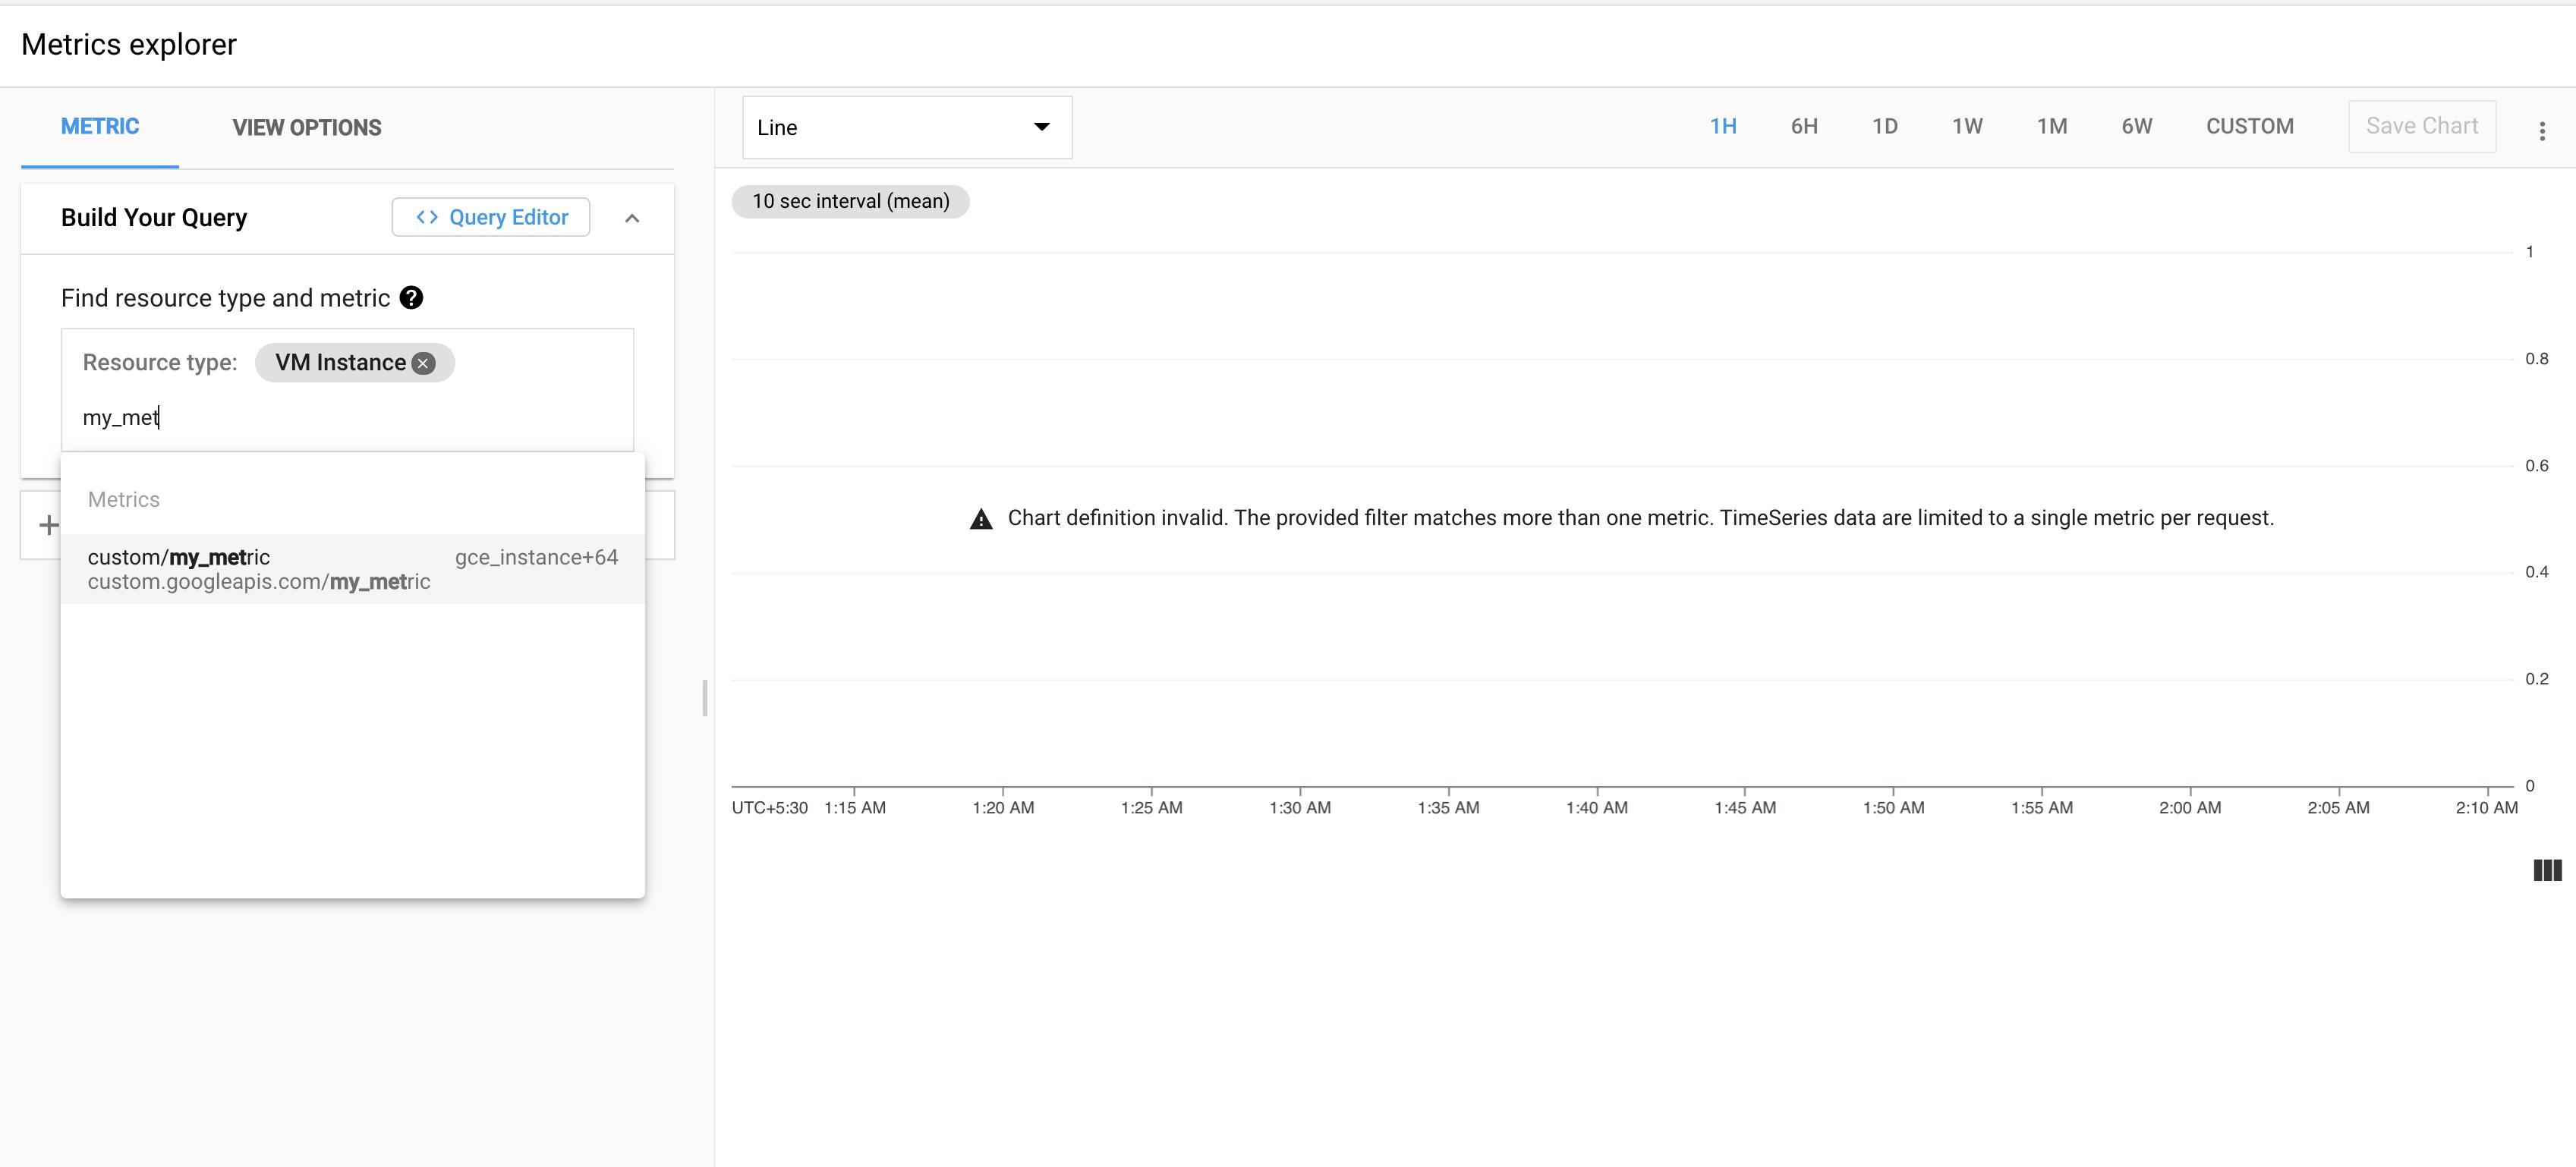 Look for your custom metric in monitoring > metric explorer.
You write data points by passing a list of TimeSeries objects to timeSeries.create. The maximum list size is 200. Each TimeSeries object must contain only a single Point object. If you want to write more than one point to the same time series, then use a separate call to the timeSeries.create.
You can thus push values against an interval for a particular time series, by changing the value for key double_value and running the code a few times. This can be used to push data as soon as a change in metric value happens. You can create triggers using async tasks in celery or make use of cloud pub/sub. Don't write data to a single time series faster than one point each 10 seconds.
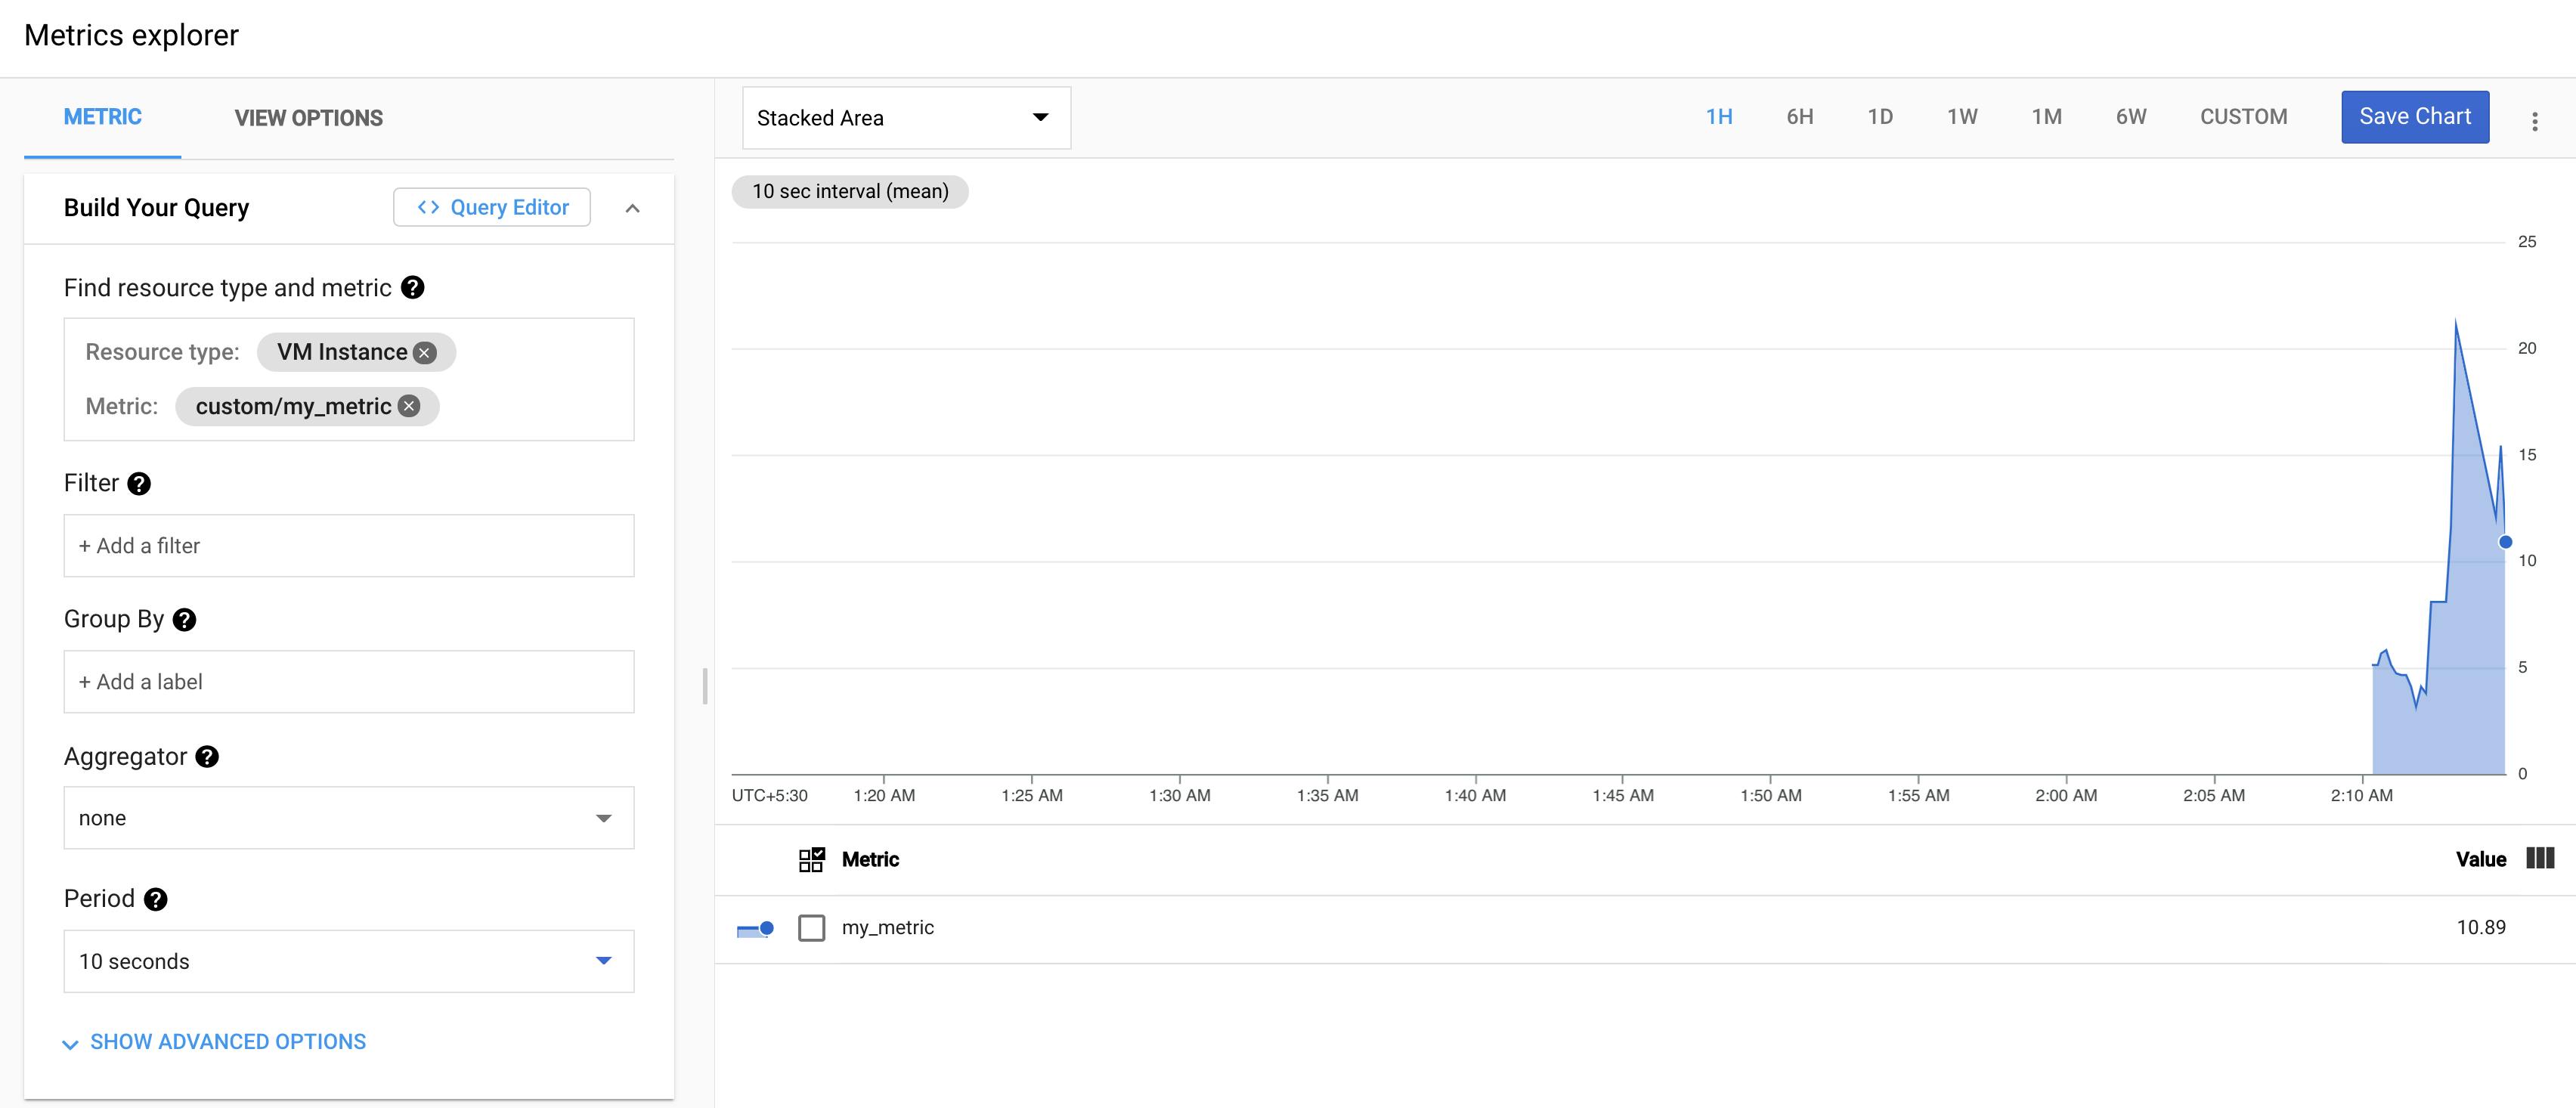 Check the monitoring dashboard under metrics explorer to see you time series making waves! 🥳
For more information, refer to cloud.google.com/monitoring/custom-metrics/.., or ping me on twitter at @arpana_naa! I love feedback!